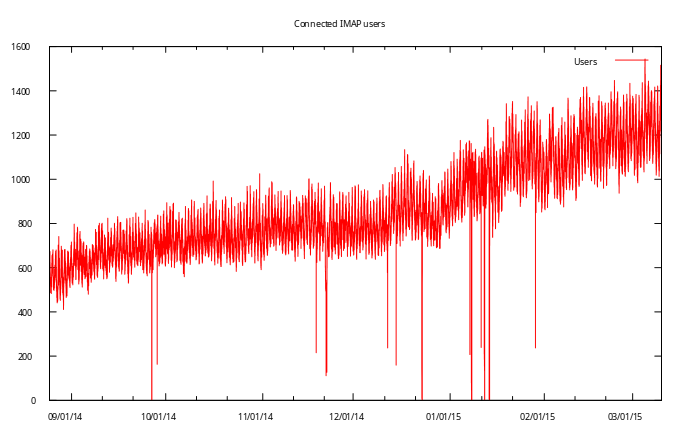
One of my favorite parts of cock.li is doing analytics on the data and making cool graphs. This post is a compilation of said cool graphs.
Most of the drops here are from restarting dovecot, but a couple of them are real downtime
The outliers are usually some type of DDoS attack, but some of them are legitimate (when @8chan.co emails were released, for example)
Let me know if there’s any other charts you’d like to see. This is about everything I have logged, though.


